The concept of the ‘value curve’ was introduced in 1997 by academics, W. Chan Kim and Renée Mauborgne. They believe that an effective strategy needs to have three main factors:
1. A clear focus.
2. Divergence from the competition.
3. A compelling tag line.
The Value Curve model aims to fulfil all of these factors. It provides a useful framework for comparing your strategy against that of your competitors, by using a simple chart. This helps you focus sharply on the things that differentiate you from your competitors, and develop a clear and easily explained value proposition.
The chart below, shows an example of how value curves can be used to compare strategies. In this example, the value curves represent the strategies used by charities to illustrate major and planned giving fundraising: a pencil and paper, excel spreadsheet & Giftabulator.
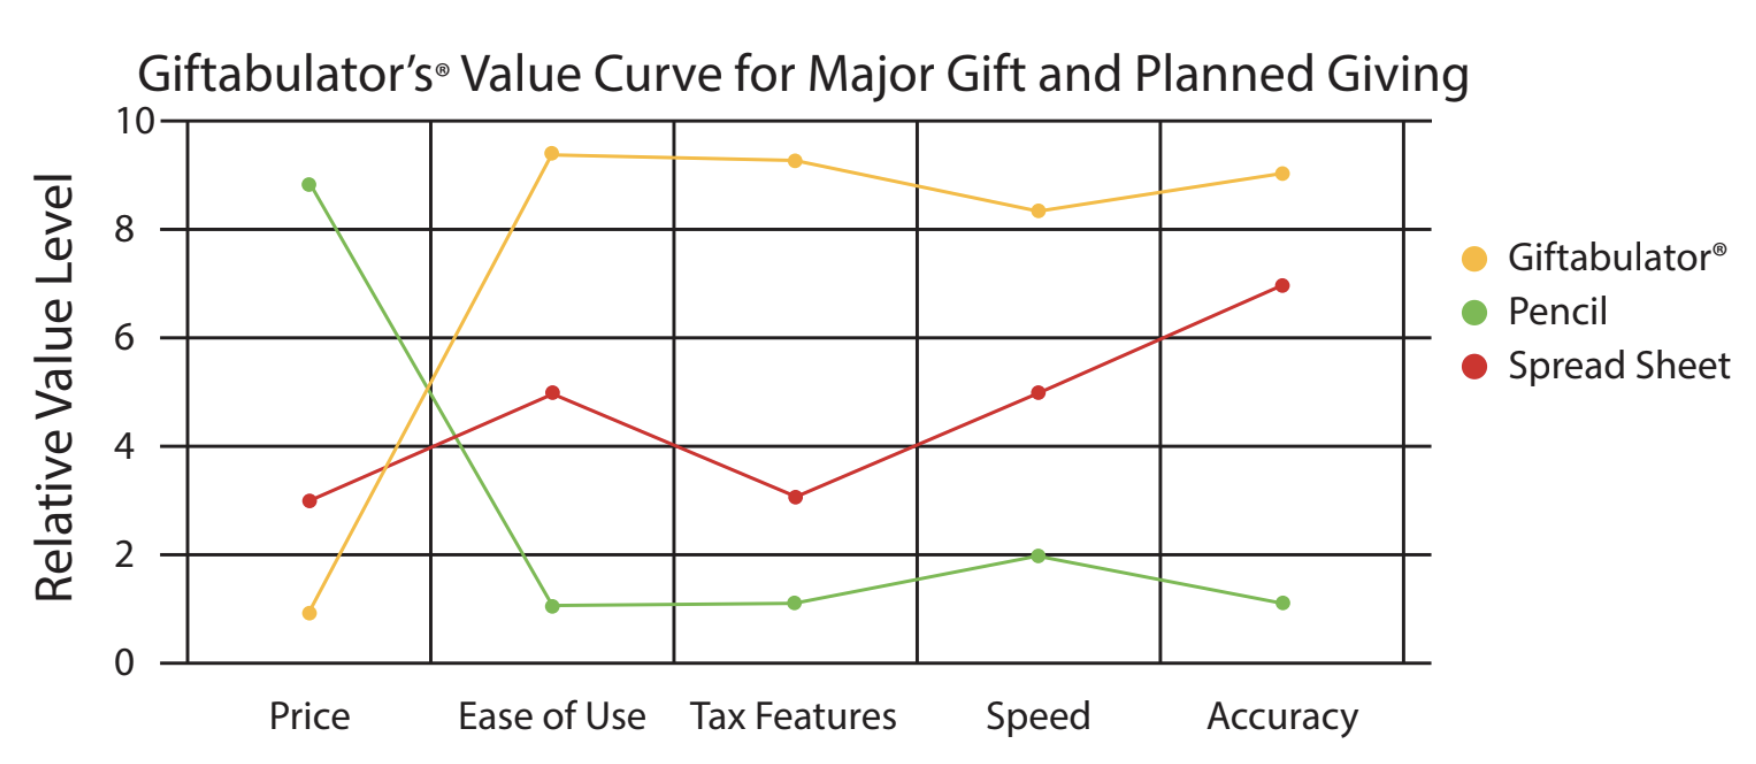
The amount of training, education and knowledge required by a charity to have their staff calculate the ideal donation either by pencil and paper or in populating an excel spreadsheet is a barrier for most charities in discussing the benefits of donating appreciated assets or incorporating a bequest within one’s estate plan.
The factors on the x axis show the key criteria or “competitive factors” that charities and those that advise or raise money in this sector think are important. The vertical axis shows the degree to which the budget and traditional tools invest in, or “value,” each of these criteria.
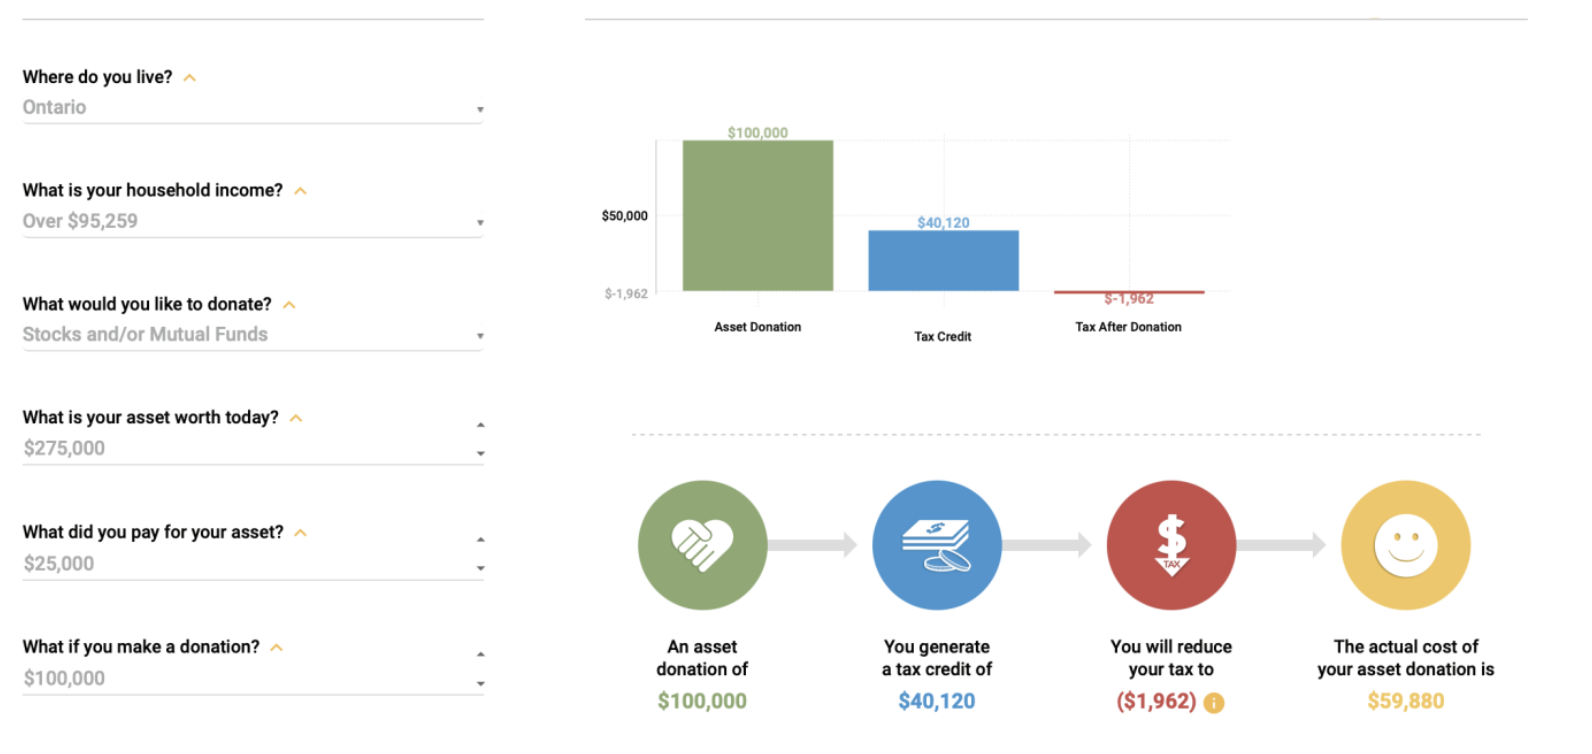
Giftabulator is pre-programed with charitable giving scenarios based on region, household income tax brackets and tax on appreciated assets such as stock, mutual funds, registered investments, secondary property and private company shares. Giftabulator generates outcomes within a split second to illustrate the benefits of a charitable donation.
Let me demonstrate how this can be illustrated: